
Who’s really using Stablecoins? Rehashing Artemis & Lightspark’s Data
We replicate Artemis & Lightspark data and audit the top wallets, revealing retail-sized transfers by count, but an intermediary- and wholesale-led system by volume.

Reference Paper: An Empirical Analysis of Stablecoin Payment Usage on Ethereum
Dune Replication: Lava VC - USDT/USDC Payment Analysis
Artemis and Lightspark recently published an analysis quantifying stablecoin payment usage by filtering out trading activity. We replicated their work for August 2024–August 20251. We have published position pieces on stablecoins (USD and local) and onchain FX, and now add a more data-driven layer to our work in this domain.
We find a material discrepancy in the paper’s reported “typical” payment size and go further by labelling top addresses by volume to understand what kinds of “payments” are actually driving stablecoin flow.
1. The “Whale” in the room: correcting the median
The original Artemis report suggests a median adjusted payment size of $24,415. Our replication of the 64.5 million transaction dataset reveals that the median payment size is ~$355.
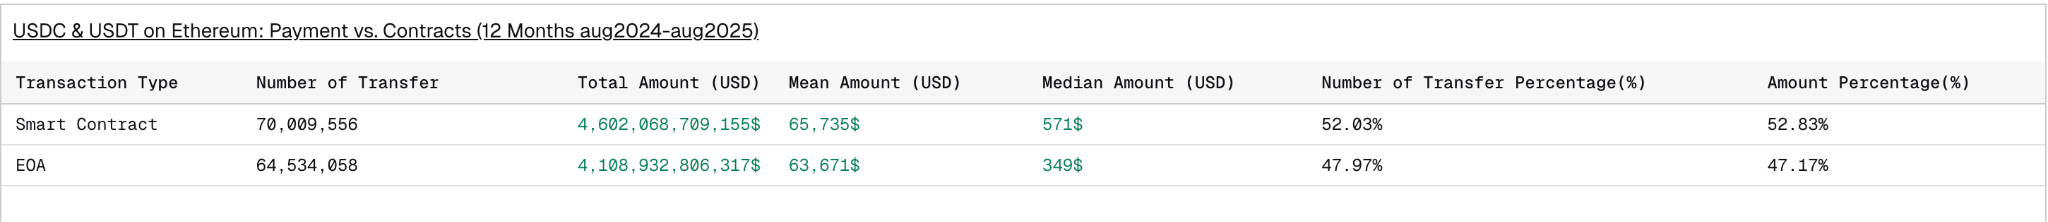
The mean transaction size remains high (~$57k) due to large-volume entities, but the median points to a retail-sized transfer. The gap between the reported figure ($24k) and our replication ($355) likely reflects differences in what “adjusted” includes (filters, exclusions, token coverage, and/or snapshot details). Either way, it reinforces a core takeaway: lower-value transfers occur frequently, and typical payment size is highly sensitive to classification.
That said, median transfer size on its own does not tell us who drives volume—which is where the picture becomes clearer.
2. Who accounts for volume?
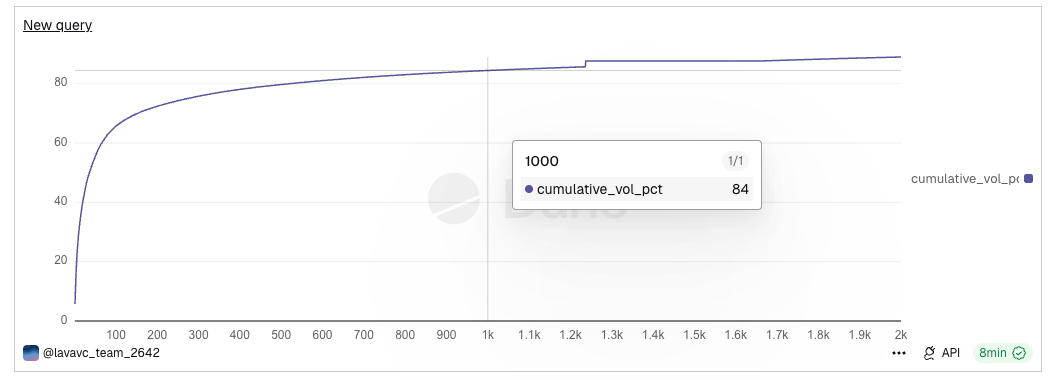
The report correctly identifies that the Top 1,000 wallets drive 84% of volume. We pushed further: the Top 100 wallets account for 66%, and the top 2,000 account for 90% of all payment volume.
At this point, the paper stops at a high-level question—whether stablecoins will evolve into an intermediary-led or P2P system. To understand what this volume actually is, we audited the Top 25 addresses (>$150B combined) by cross-referencing identity labels and analysing behavioural fingerprints (median transfer size and unique receiver counts).
We classify these top-volume actors into three primary categories.
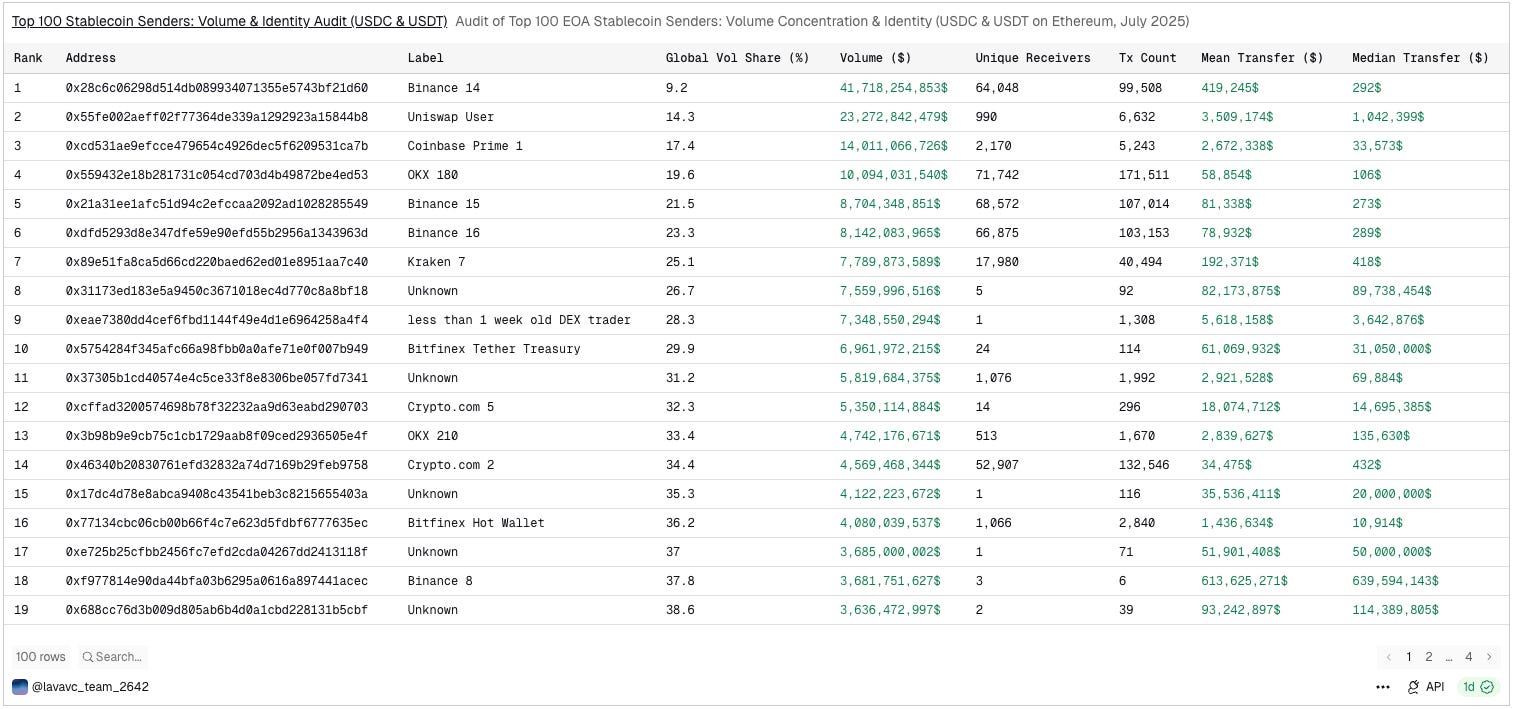
Category A: Exchange hubs
This category includes 9 of the Top 25 wallets (e.g., Binance 14, OKX 180, Kraken 7, Crypto 2) and accounts for approximately $82B (53%) of analysed volume. The fingerprint combines very high activity (170,000+ transactions) with low median transfer sizes ($106–$492), consistent with retail-sized movement.
But these flows are a black box in terms of intent. It is difficult to distinguish commercial payments (User A paying User B via an exchange) from self-custody withdrawals (User A moving funds to a Ledger) or internal exchange operations. While significant, it is likely an overstatement to treat all 53% as end-user “payments” in the everyday sense.
Category B: Institutional sweepers
This category includes 7 of the Top 25 wallets (Ranks 8, 9, 15, 17, 18, 19, 25), accounting for ~$33B in volume. These actors are characterised by extremely high transfer values (median $20M–$640M) and a pattern of interacting with a single unique receiver. This behaviour is consistent with internal liquidity sweeps or wholesale settlement rather than merchant or P2P payment activity.
Category C: The treasury layer
This category includes issuers and institutional exchanges such as Circle Treasury, Bitfinex Tether Treasury, and Coinbase Prime. Together, they account for ~$40B+ in volume. Their profile—high median transfers ($10k–$30M) and moderate transaction counts (1k–6k)—reflects the wholesale supply management layer of the ecosystem.
If you remove these 25 wallets, half the “payment” volume disappears. The network is currently a wholesale settlement layer that supports an opaque retail withdrawal ecosystem.
3. Identifying methodological blind spots
The current industry standard for measuring “payments” remains imperfect. To truly understand stablecoin payments in 2026, we have to account for:
The L2 Migration: Current methodology focuses on Ethereum L1, excluding bridge contracts. This likely misses the “real” payment migration to Layer 2 networks (Base, Arbitrum, Celo etc.) where fees are lower.
Self-Custody vs. Payments: The EOA-to-EOA (Externally Owned Account) filter cannot distinguish between a merchant payment and a user moving funds between their own wallets (e.g., Exchange to Ledger). This becomes increasingly meaningless as more people and products adopt “smart accounts” based on Account Abstraction.
The Visibility Gap: ~$33B of volume (Category B) lacks public identity tags. Without these labels, institutional rebalancing is frequently miscategorized as “Peer-to-Peer” activity.
In conclusion
The Artemis/Lightspark methodology is a helpful step towards sanitizing onchain data, but it remains true that you are better off verifying things for yourself.
Stablecoins today are a tale of two cities: Institutions drive the volume, but users drive the transaction count. The ~$355 median is the most optimistic data point for the future—it shows that programmable money is working at scale (even if that money remains pegged to a fiat currency). However, the fact that 53% of volume is trapped in exchange hubs suggests we haven’t disintermediated payments; we’ve just swapped banks for (arguably more opaque) exchanges.
For our audit of top addresses, we restricted the dataset to July 4–31, 2025 to match the authors’ snapshot period and ensure like-for-like comparison.
 | A guest post by
|